Prepare for Full-Blown Recession to Hit in the Summer
Commentary
My private theory is that we never really left the recession that began March 2020 with lockdowns. Real household income and labor participation still haven’t recovered. Productivity has crawled along but within the range of statistical error. No question that the U.S. economy has downshifted.
Whatever pathetic growth we experience now barely registers as compared with other periods in the postwar period and is largely wiped out by the sheer chaos of the times.
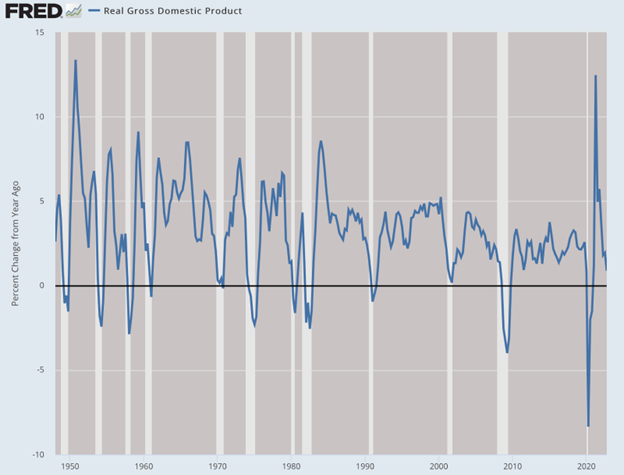
That intuition aside, let’s talk about the data we have. We did have two quarters of falling GDP last year but that decline leveled off. To be sure, these data markers can be sketchy and poorly assembled (government spending contributes to growing the GDP in a technical sense) so we can’t put a great deal of stock in them.
Still, even from a data point of view, there is every reason to suppose that a recession is on its way, inexorably and inevitably.
They say never make a prediction with both a number and a date. Always leave one open.
Fine but I will break that rule and say that by June, the CPI will be down to 4 percent—twice the target rate—but business will be suffering. The recession will be confirmed in the fall just as it gets deeper and deeper.
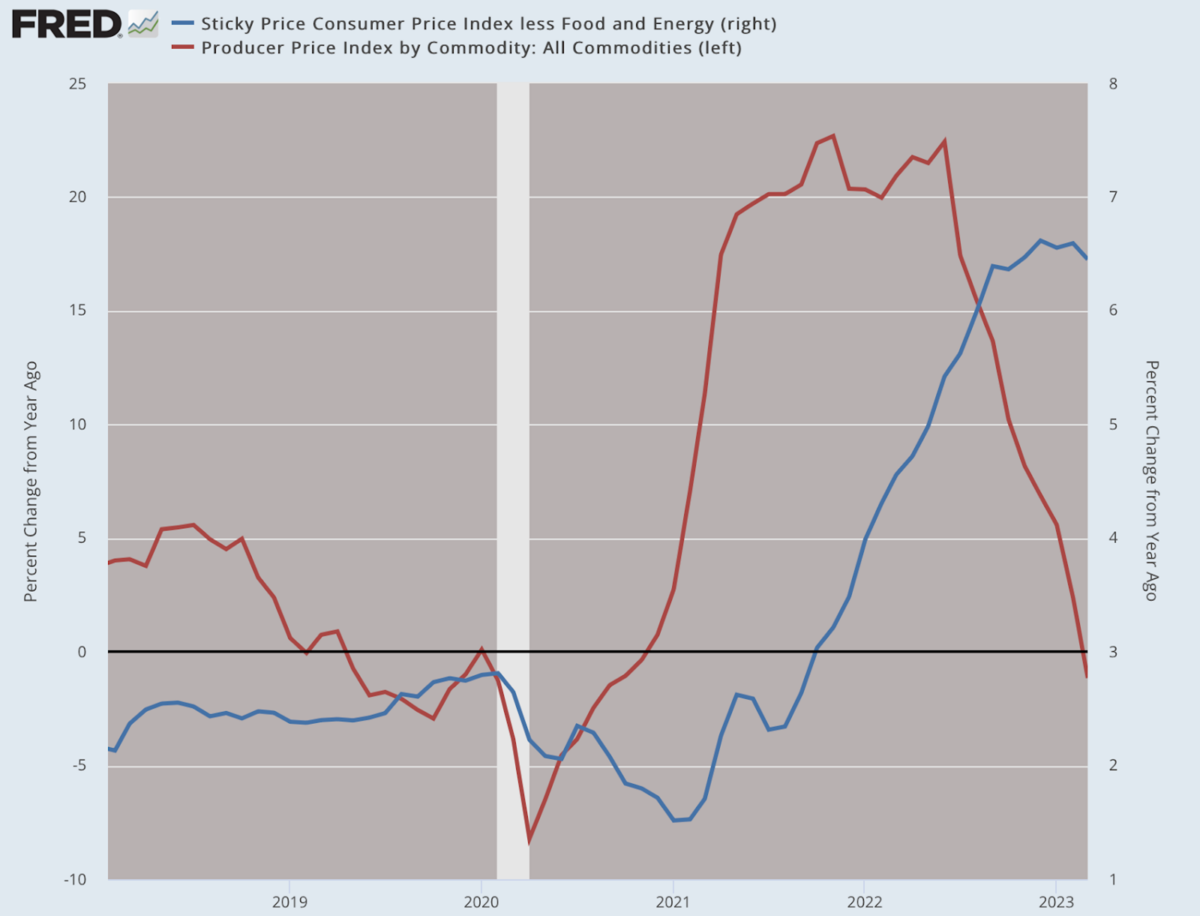
There are many signs pointing in this direction. To see them, however, you need to look squarely at the production structures. The Producer Price Index this week was a bit of a stunner. Everything was down rather dramatically. That could be a one-month trend, true. But it could also represent a major slowdown in demand in less visible sectors, putting downward price pressure to dump existing inventory.
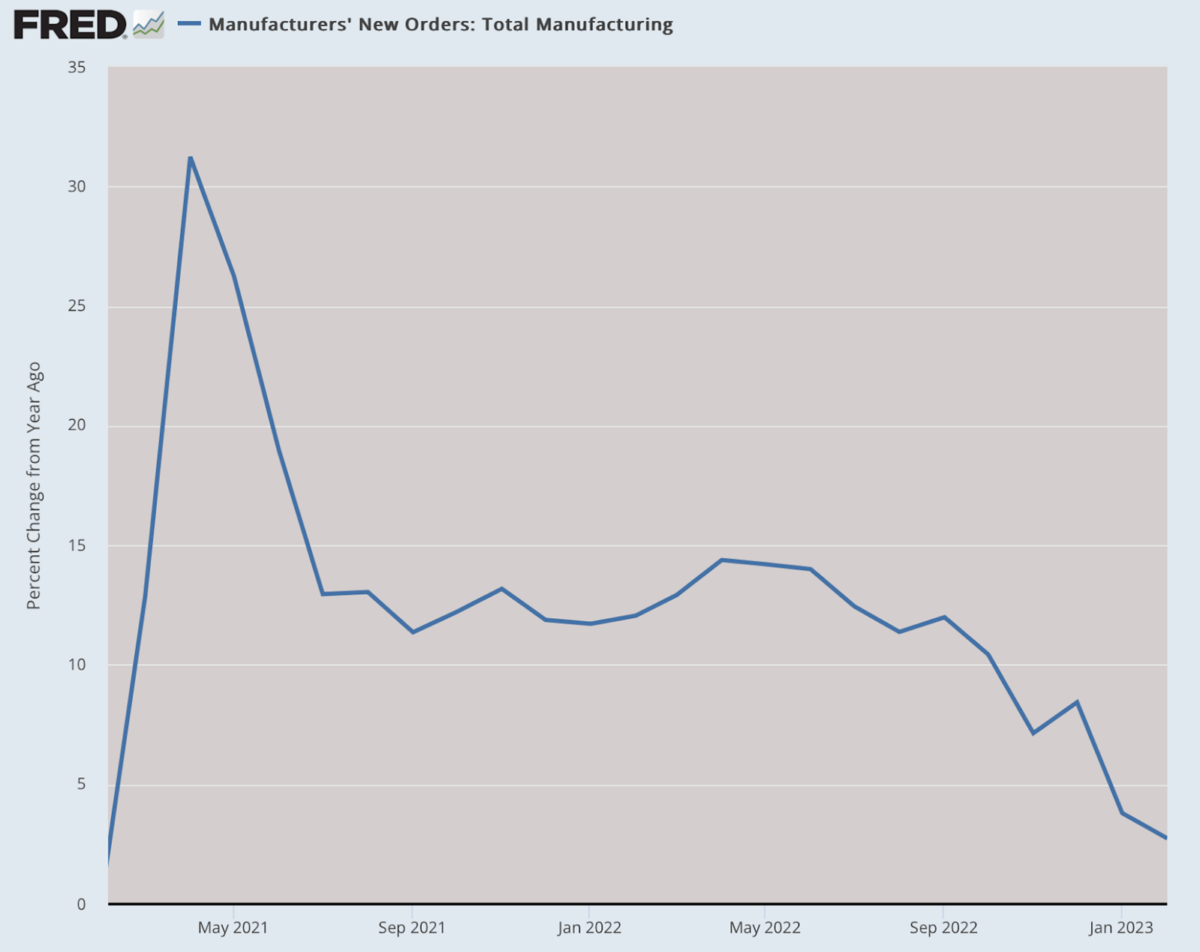
Manufacturing is a good place to look. New orders are tumbling. This is not supposed to be happening in an economy that Janet Yellen claims is excellent.
What we see here might be the impact of higher borrowing rates and thus deleveraging across all industries. There is no question that we have two hugely crucial points of data here: money supply, which is falling dramatically, and a notable drop in bank loans.
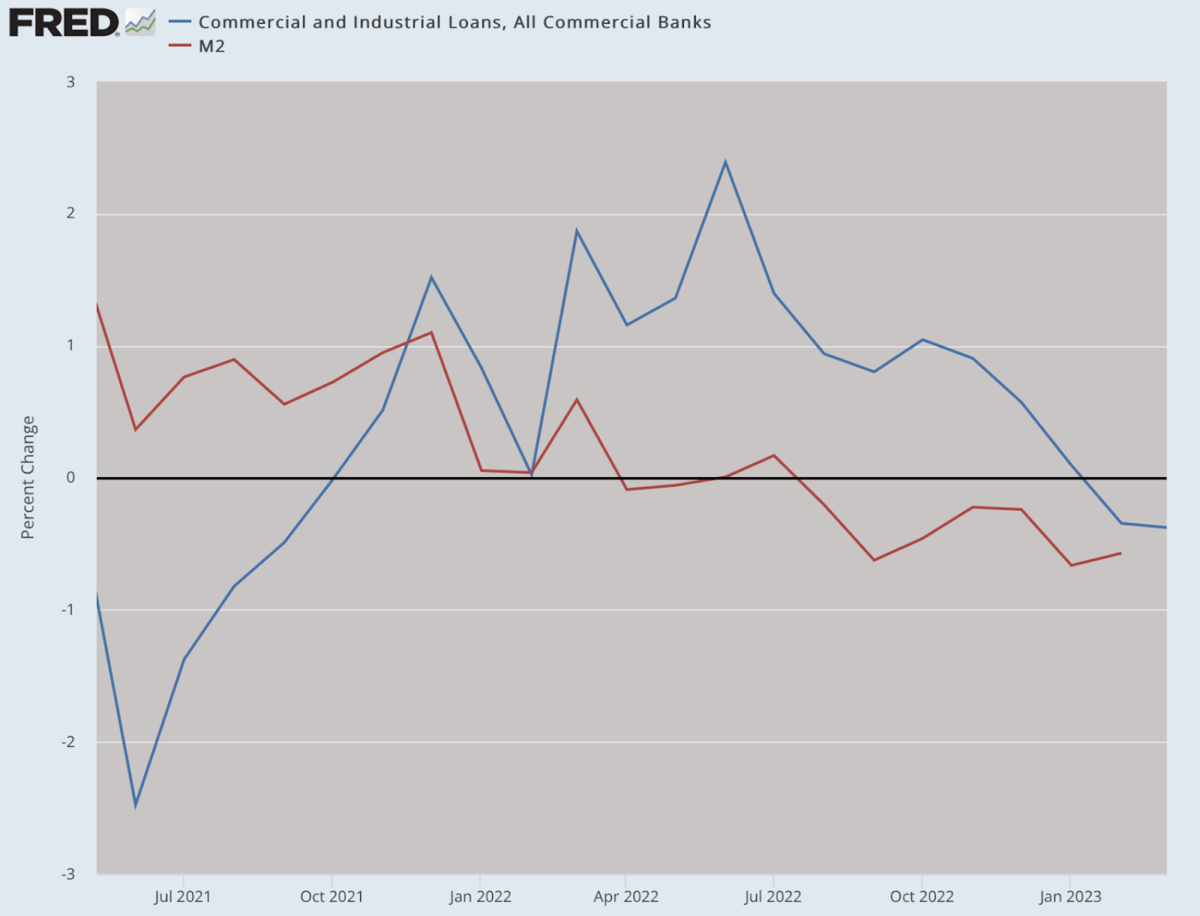
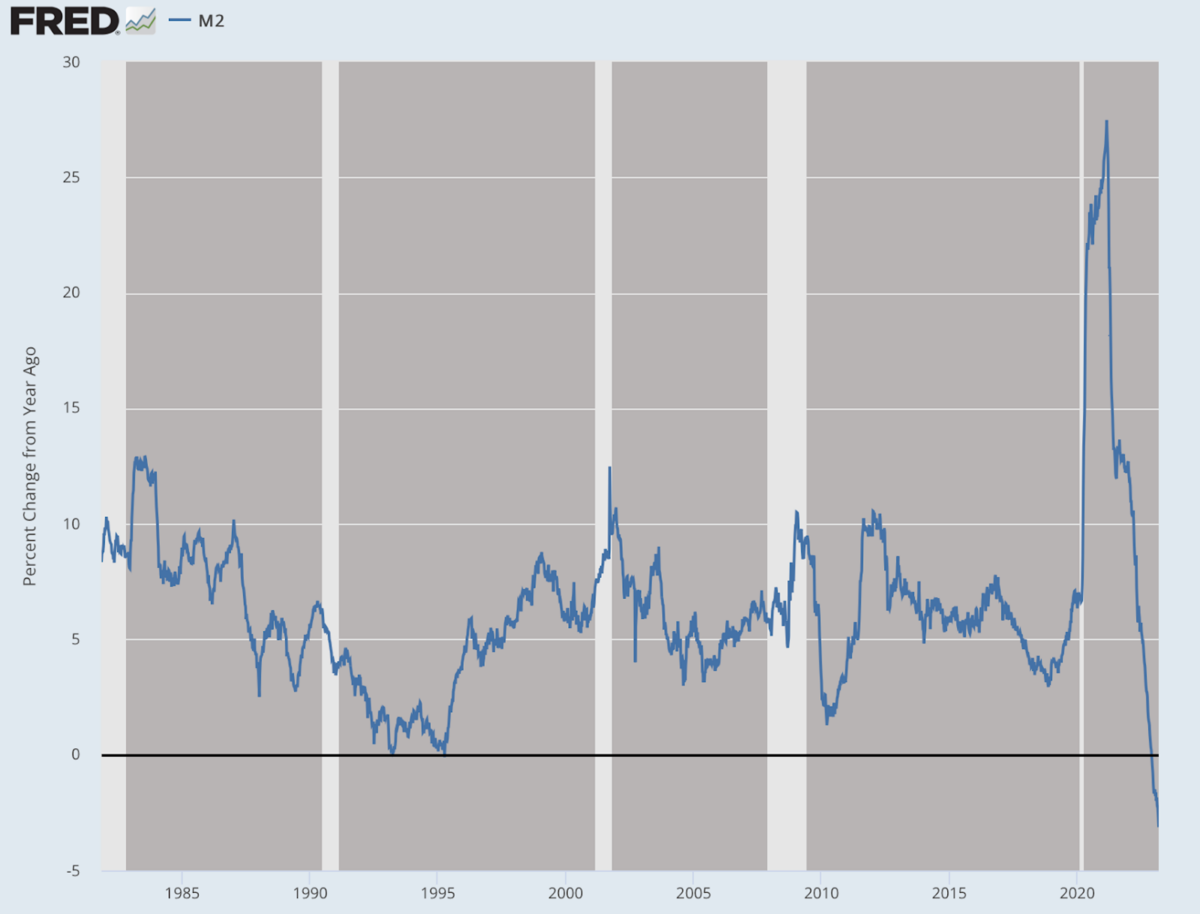
A falling money supply is almost always a signal of depressed economic times. Let’s take a closer look at that. We don’t have M2 data to take us back to the times before financial deregulation. But based on what we are seeing here, there’s never been anything like this in our lifetimes or really ever. Fully $1 trillion has been sucked out of the total supply over the last year, or 4.5 percent of the total.
That’s not as extreme as the decline in money supply from 1929 to 1932, which at some point fell 15 percent year over year. But on the other hand, the dollar amount of collapse today is much larger. No one knows for sure what the impact will be, especially since this is occurring during significant moves globally to de-dollarize international trade.
How precisely does this happen? When money supply expands, the Fed buys debt created by Congressional spending and the Treasury Department with new money and that money is injected into the banking system or directly into the pockets of recipients.
Depending on a number of factors, this creates industrial subsidies and distortions or inflation or both. The tool here that the Fed uses most times is the lending system through its member banks. That’s the hose that delivers the new paper. Meanwhile, the Fed is stuck with a larger balance sheet.
This is not a sustainable policy over the long run. It has to come to an end.
In monetary shrinking, the opposite happens. The Fed tries to offload assets through selling assets on the market. That process sponges up some of the excess where possible. This is only the second time in Fed history that it has undertaken major efforts to shrink its balance sheet in a process known as Quantitative Tightening. In other words, it has only tried this once in 2019 and that was stopped with pandemic loosening.
Why would the Fed have to engage in Quantitative Tightening as a means of inflation control?
First, it needs to limit losses and risk exposure on its portfolio due to higher interest rates. Those losses have been growing this year. Second, the Fed would do this to rebalance its portfolio away from stuff it doesn’t want (like mortgage-backed securities) to make room for more government debt. Third, it needs to free up room for the possibility of Quantitative Easing in the future, whereas that becomes impossible with too bloated a balance sheet.
There are huge macroeconomic risks associated with this strategy. No one even knows the full extent of what they are. Even the Richmond Fed admits this: there are theories but no practical experience. In other words, the Fed is experimenting again.
At the same time the Fed is tightening, banks are under great pressure right now due to their own bloated balance sheets with devalued assets combined with steep drawdowns on cash from their own borrowers who are paying higher and higher rates to service loans.
A final factor is the enormous shift out of cash balances into the money market, which is paying a near-positive rate of return for the first time since 2008. This is huge. People are moving money from banks to brokers, away from stockpiling to investing in safe Treasuries that are paying 4 percent and higher. This is causing a drain on the banks right now. With less money to lend, existing loans are expiring and not being replaced, thus draining the money supply further.
In all, these are very exciting times for anyone fascinated by monetary and financial economics simply because we’ve never seen anything like this. Sadly, it is not likely to end well. If you have all the confidence in the world that 5 percent and more of the money supply can be sucked away without consequence following the largest printing bonanza in history, you are welcome to hold that view. I have my doubts.
The first strong signal I saw of something dramatic taking place was of course with the Producer Price Index (PPI) numbers released this week. Usually in normal times, the Consumer Price Index (CPI) and the PPI track each other closely. But with the unthinkable disruptions of lockdowns, that relationship utterly blew apart. The PPI became the prime mover with a 3–4 month lag in the CPI. The PPI this week looked very different from the CPI. Consumer prices still came in hot but PPI was down across the board.
This will certainly impact the consumer sector if the lag times persist. The date here will be the summer.
Strangely I saw almost no comment on this trend outside The Epoch Times. To be sure, it could reverse next month but it’s doubtful, not with money supply collapsing, the Fed’s balance sheet unraveling, and banks themselves dealing with a deposit drain at the same time.
If we are headed toward another Great Depression, combined with higher-than targeted inflation, which is entirely possible, how exactly will historians tell this enormously complex story? There are so many moving pieces and very few intellectuals or even economists competent enough to understand and explain. In the end, there is one point on which the entire saga turns: the lockdowns. This is what blew up the world and wrecked economic functioning. All the rest is data.
The Fed has absolutely made a mess of the world. They caved to the wacko pandemic planners and their evil schemes. The money expansion at one point reached 26 percent year-over-year. The damage of that policy was done. It is not undone by reversing expansion with dramatic shrinkage.
I hope I’m wrong in my predictions. If I’m correct, don’t expect me to make another one. I’m usually not certain enough to put them on paper. This time, however, there are simply too many signs to ignore. I also suspect that in ten years, we’ll be backdating the onset of the great decline to March 2020.
Views expressed in this article are the opinions of the author and do not necessarily reflect the views of The Epoch Times.