April Jobs Prints at 253,000, but With 149,000 Downward Revisions
New jobs created printed at 253,000 on May 5, according to the Establishment Survey, well above market expectations of 180,000 jobs. Net revisions were down 149,000 jobs from February and March. That makes the average three-month creation of 222,000 jobs.
The Household Survey, which is compiled from different data, showed 139,000 people were newly employed.
Both the unemployment rate, at 3.4 percent, and the number of unemployed persons, at 5.7 million, changed little from March figures of 3.5 percent and 5.8 million, respectively.
The U6 number was 6.6 percent. The U6 is a measure of the total unemployed plus all persons marginally attached to the labor force plus total employed part-time for economic reasons, as a percent of the civilian labor force, plus all persons marginally attached to the labor force. The labor participation rate remained 62.6 perecent.
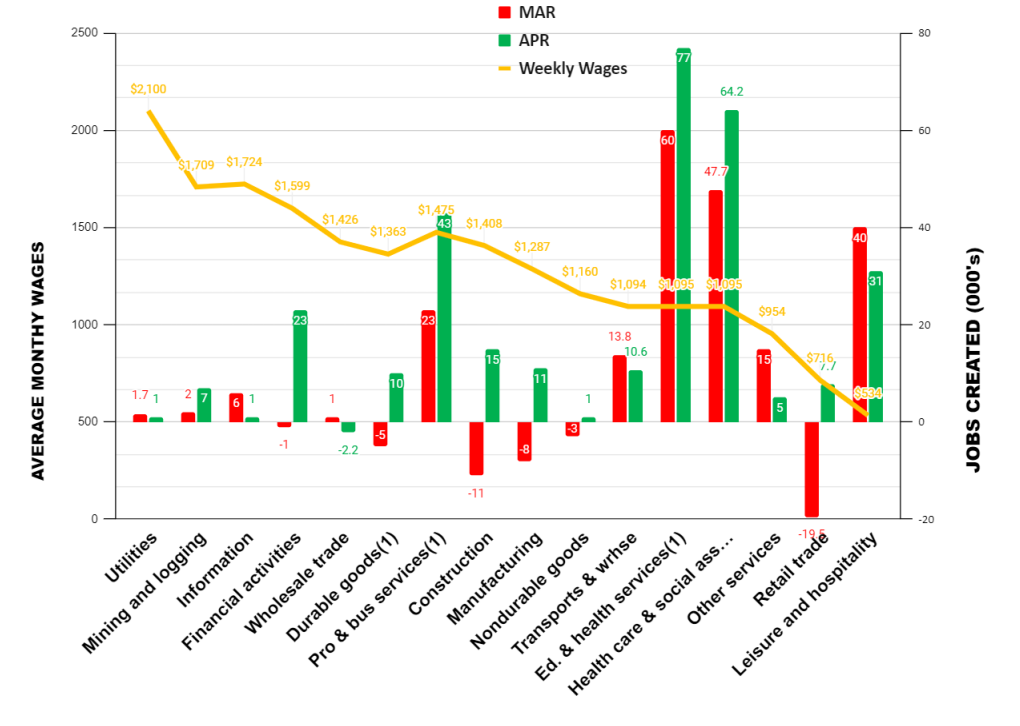
Let’s look at our exclusive chart of jobs creation by average weekly wages:

Annual real (i.e., adjusted for inflation) wages, which we present quarterly, declined in April in all categories of employment, except mining and logging, utilities, and construction.
Employment in sectors that tend not to have government support had their biggest gains in professional and business services.
Jobs in education and health services are private employment, but tend to be heavily subsidized by the government with federal programs such as Medicare, Medicaid, and federally guaranteed student loans. Pure government employment, which is not reflected in the chart, added another 23,000 jobs. Employment in leisure and hospitality, workers such as hotel maids, restaurant servers, and bartenders, declined nearly 25 percent from last month.
Other Data
The April ISM Manufacturing Index printed Monday at 47.1, up slightly from the abysmal 46.3 that printed for March and slightly above market expectations.
Wednesday’s release of the ISM Services Index showed growth at 51.9 percent. The good news in the Services Index was the strong reversal of export services orders, which climbed 17.2 percentage points from a contracting 43.7 percent to a growing 60.9 percent.
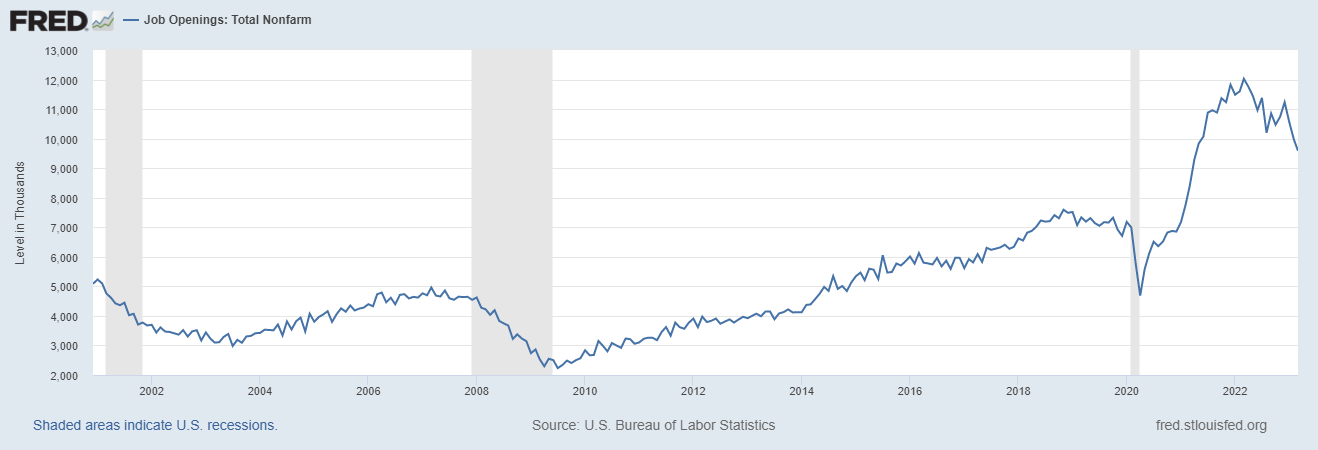
The Job Opening and Labor Turnover Survey (JOLTS) print for March, which printed on May 2, was down 384,000. Much of that is the economy returning to the normal pace of jobs creation, shown in the chart below; some of it is furloughed employees returning to work at their former employers, and a fair deal of it is the continuing slowdown of the economy.

Building permits in March, released April 18, were at a seasonally adjusted annual rate of 1,413,000. This is 8.8 percent below the revised February rate of 1,550,000 and is 24.8 percent below the March 2022 rate of 1,879,000. Privately owned housing starts in March were at a seasonally adjusted annual rate of 1,420,000. This is 0.8 percent (±13.0 percent) below the revised February estimate of 1,432,000 and is 17.2 percent (±9.1 percent) below the March 2022 rate of 1,716,000. Both figures, which are, again, for March, add further evidence to the thesis of a rapid deceleration of the construction business.
For March, personal income and outlays, released April 28, showed disposable personal income up 0.4 percent in current dollars and 0.3 percent in chained 2012 dollars. Personal income in current dollars was up 0.3 percent. The Personal Consumption Expenditures (PCE) Index, excluding food and energy, reported to be the Federal Reserve’s preferred measure of inflation, printed at 4.6 percent. (“Chained dollars” is a measure of inflation that takes into account changes in consumer behavior in response to changes in prices.)
The IBD/TIPP Economic Optimism Index, released April 4, increased just 1.1 percentage points, to 47.4, and remains pessimistic. (Anything above 50 indicates growth.) The May survey has not yet been released.
Last month’s Federal Reserve’s so-called “dot-plot” projections as to the future of the economy were released March 22. They showed a median estimate of GDP growth of 0.4 percent for 2023, 1.2 percent for 2024, and 1.9 percent for 2025. They also show inflation continuing above the Fed’s inflation target of 2 percent through at least 2025. A new set of prognostication will be released by the Fed for their June meeting.
Labor productivity continues to disappoint. Nonfarm business sector labor productivity decreased 2.7 percent in the first quarter of 2023. The 0.9 percent productivity decline is the first time the four-quarter change series has remained negative for five consecutive quarters; this series began in the first quarter of 1948.
Opinion
Commercial banks have suffered more than $400 billion in deposits withdrawals, or 2.25 percent, from March 8 to April 19, roughly coinciding with concerns about the banking sector after Silicon Valley Bank failed. Many of those deposits are believed to have shifted to money market accounts. Moreover, as we discussed here, there are concerns about commercial real estate loans and how they will affect lending going forward. We see credit tightening as banks build reserves to cover bad real estate loans. (Bank of America, for example, added $931 million to reserves for the first quarter compared to just $30 million for the same period last year.)
Too many people put too much stock in the so-called “headline” jobs number without getting granular as we do. The enormous revisions of the February and March jobs creation numbers are deeply troubling and point to some issues with the reliability of the Bureau of Labor Statistics jobs data, month to month. The downward revisions equal about the amount of jobs economists consider necessary to absorb the national population growth, at about 150,000 jobs. Including today’s data, the average three-month jobs creation is 222,000. That’s good, but not so robust that the Federal Reserve need escalate rate increases by a full percentage point to forestall inflation.
But if the February and March downward revisions are subtracted from today’s jobs print, it would net to just over 100,000 jobs. That’s coupled with a recent survey of small businesses—America’s leading jobs creators—finding it tough to make rent payments. All this causes us to continue to abide by our view that there will be a recession commencing in the third quarter (to be acknowledged sometime in 2024). But the Fed’s statement Wednesday, which dropped language from the March statement about “anticipating ” future rate increases, allows the Fed to pause at its next meeting on June 13–14 or to continue them. That June meeting will include the Fed’s s0-called “dot-plot” projections, so we’ll have a much better indication of Fed policy going forward. Again, we think that the Fed has been chastened by the banking crisis, which was exacerbated by Fed tightening. We believe, moreover, as we discussed above, that banks will fortify their balance sheets and become more restrained in their lending, effectively doing the Fed’s tighening for them.
Today’s print of jobs was surprising, but we continue to believe there will be no “soft landing.” There will be a mild recession in the second half that could worsen in 2024, depending on the policy response.
We predict second quarter 2023 GDP will print between 0.25 percent (one-quarter percentage point) and 1.0 percent. Jobs numbers, which have not printed below expectations in nearly a year, will most likely print below 200,000 new jobs beginning in the third quarter.
NOTE:
Our commentaries most often tend to be event-driven. They are mostly written from a public policy, economic, or political/geopolitical perspective. Some are written from a management consulting perspective for companies that we believe to be underperforming and include strategies that we would recommend were the companies our clients. Others discuss new management strategies we believe will fail. This approach lends special value to contrarian investors to uncover potential opportunities in companies that are otherwise in a downturn. (Opinions with respect to such companies here, however, assume the company will not change).
The views expressed, including the outcome of future events, are the opinions of the firm and its management only as of May 5, 2023, and will not be revised for events after this document was submitted to The Epoch Times editors for publication. Statements herein do not represent, and should not be considered to be, investment advice. You should not use this article for that purpose. This article includes forward-looking statements as to future events that may or may not develop as the writer opines. Before making any investment decision you should consult your own investment, business, legal, tax, and financial advisers. We associate with principals of TechnoMetrica, publishers of the TIPP Index on survey work in some elements of our business unrelated to that index.


